What a Median Home Costs Per Month, by State (2026)
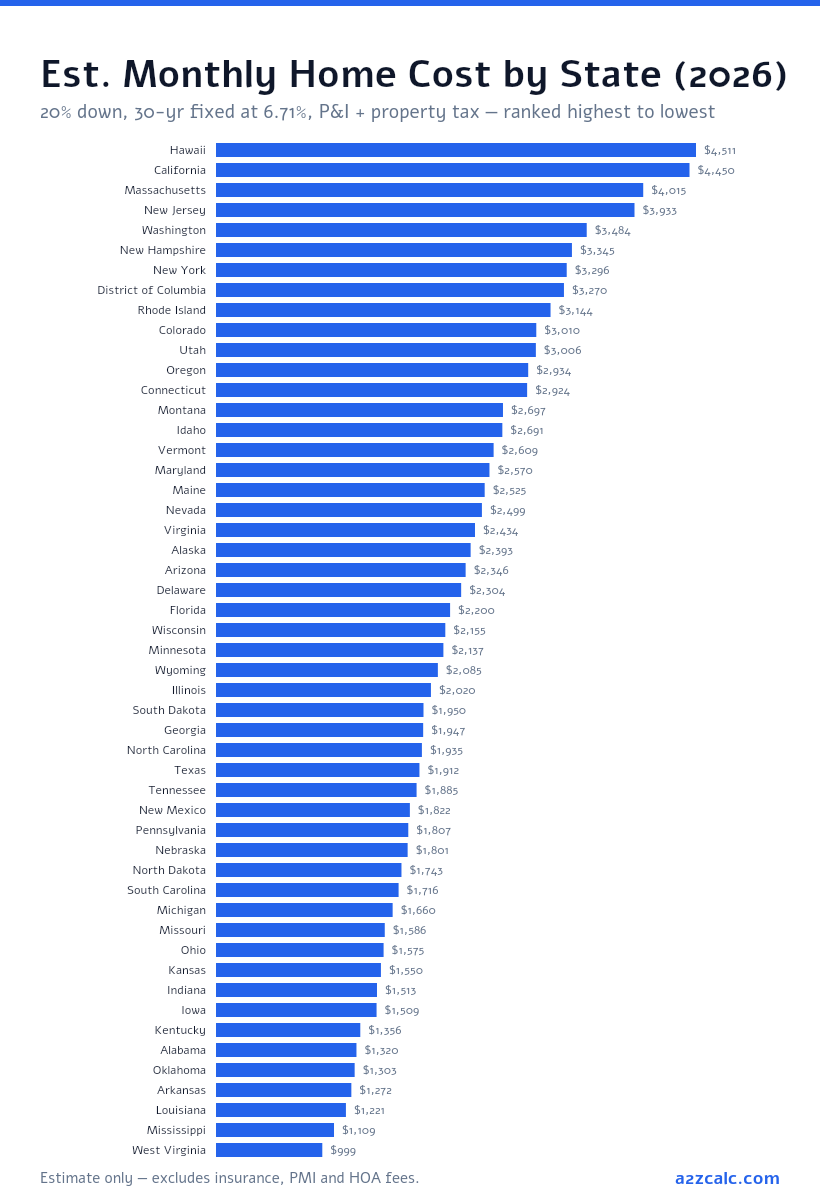
There's no single "typical" mortgage payment, because so much depends on where the home is. This study runs the same simple example in every US state. A buyer puts 20% down on that state's typical home, borrows the rest over 30 years at the current national average rate, and pays the state's typical property tax rate on top.
The result is one monthly figure for each of the 51 (50 states plus DC) that you can compare directly, ranked from highest to lowest. How it was worked out, and every source, is below the table.
The full ranking
Estimated monthly cost (principal, interest and property tax) for a 20%-down, 30-year loan at the current 6.71% national average rate, on each state's typical home value:
| Rank | State | Home value | Loan (80%) | P&I/mo | Property tax/mo | Total/mo |
|---|---|---|---|---|---|---|
| 1 | Hawaii | $833,877 | $667,102 | $4,309 | $202 | $4,511 |
| 2 | California | $773,735 | $618,988 | $3,998 | $451 | $4,450 |
| 3 | Massachusetts | $669,053 | $535,242 | $3,457 | $558 | $4,015 |
| 4 | New Jersey | $584,072 | $467,258 | $3,018 | $915 | $3,933 |
| 5 | Washington | $601,545 | $481,236 | $3,109 | $376 | $3,484 |
| 6 | New Hampshire | $521,177 | $416,942 | $2,693 | $651 | $3,345 |
| 7 | New York | $527,312 | $421,850 | $2,725 | $571 | $3,296 |
| 8 | District of Columbia | $577,041 | $461,633 | $2,982 | $289 | $3,270 |
| 9 | Rhode Island | $515,289 | $412,231 | $2,663 | $481 | $3,144 |
| 10 | Colorado | $538,932 | $431,146 | $2,785 | $225 | $3,010 |
| 11 | Utah | $539,949 | $431,959 | $2,790 | $216 | $3,006 |
| 12 | Oregon | $502,156 | $401,725 | $2,595 | $339 | $2,934 |
| 13 | Connecticut | $453,319 | $362,655 | $2,343 | $582 | $2,924 |
| 14 | Montana | $475,191 | $380,153 | $2,456 | $242 | $2,697 |
| 15 | Idaho | $481,825 | $385,460 | $2,490 | $201 | $2,691 |
| 16 | Vermont | $405,980 | $324,784 | $2,098 | $511 | $2,609 |
| 17 | Maryland | $433,112 | $346,490 | $2,238 | $332 | $2,570 |
| 18 | Maine | $421,966 | $337,573 | $2,181 | $345 | $2,525 |
| 19 | Nevada | $447,473 | $357,978 | $2,312 | $186 | $2,499 |
| 20 | Virginia | $418,375 | $334,700 | $2,162 | $272 | $2,434 |
| 21 | Alaska | $402,190 | $321,752 | $2,078 | $315 | $2,393 |
| 22 | Arizona | $421,381 | $337,105 | $2,178 | $169 | $2,346 |
| 23 | Delaware | $410,192 | $328,154 | $2,120 | $185 | $2,304 |
| 24 | Florida | $378,167 | $302,534 | $1,954 | $246 | $2,200 |
| 25 | Wisconsin | $343,798 | $275,038 | $1,777 | $378 | $2,155 |
| 26 | Minnesota | $356,066 | $284,853 | $1,840 | $297 | $2,137 |
| 27 | Wyoming | $371,685 | $297,348 | $1,921 | $164 | $2,085 |
| 28 | Illinois | $299,900 | $239,920 | $1,550 | $470 | $2,020 |
| 29 | South Dakota | $324,891 | $259,913 | $1,679 | $271 | $1,950 |
| 30 | Georgia | $334,119 | $267,295 | $1,727 | $220 | $1,947 |
| 31 | North Carolina | $338,359 | $270,687 | $1,748 | $186 | $1,935 |
| 32 | Texas | $301,806 | $241,445 | $1,560 | $352 | $1,912 |
| 33 | Tennessee | $336,508 | $269,206 | $1,739 | $146 | $1,885 |
| 34 | New Mexico | $320,106 | $256,085 | $1,654 | $168 | $1,822 |
| 35 | Pennsylvania | $290,552 | $232,442 | $1,501 | $305 | $1,807 |
| 36 | Nebraska | $282,767 | $226,214 | $1,461 | $339 | $1,801 |
| 37 | North Dakota | $293,741 | $234,993 | $1,518 | $225 | $1,743 |
| 38 | South Carolina | $307,777 | $246,222 | $1,590 | $126 | $1,716 |
| 39 | Michigan | $269,576 | $215,661 | $1,393 | $267 | $1,660 |
| 40 | Missouri | $268,420 | $214,736 | $1,387 | $199 | $1,586 |
| 41 | Ohio | $249,941 | $199,953 | $1,292 | $283 | $1,575 |
| 42 | Kansas | $250,918 | $200,734 | $1,297 | $253 | $1,550 |
| 43 | Indiana | $260,808 | $208,646 | $1,348 | $165 | $1,513 |
| 44 | Iowa | $240,435 | $192,348 | $1,242 | $266 | $1,509 |
| 45 | Kentucky | $234,510 | $187,608 | $1,212 | $145 | $1,356 |
| 46 | Alabama | $241,009 | $192,807 | $1,245 | $74 | $1,320 |
| 47 | Oklahoma | $223,612 | $178,890 | $1,156 | $147 | $1,303 |
| 48 | Arkansas | $225,822 | $180,658 | $1,167 | $105 | $1,272 |
| 49 | Louisiana | $217,092 | $173,674 | $1,122 | $100 | $1,221 |
| 50 | Mississippi | $196,333 | $157,066 | $1,015 | $95 | $1,109 |
| 51 | West Virginia | $178,702 | $142,962 | $923 | $76 | $999 |
Unweighted average across all 51: $2,303/month. P&I = principal and interest only; excludes homeowners insurance, PMI and HOA fees, which are not in any of the three source datasets.
Methodology
Each state's monthly figure comes from three numbers, each from its own source, plus one shared assumption: a 20% down payment and a 30-year term, the same in every state, so that location is the only thing that really changes.
Home value comes from Zillow's Home Value Index (ZHVI) by state, a smoothed and seasonally adjusted measure of what a typical home is worth, as of the latest month available (2026-07-31). It's close to the Census Bureau's median home value but not the same. ZHVI is used here because it's updated monthly rather than yearly, and the figures could be reproduced straight from Zillow's public data files.
The mortgage rate is the national weekly average for a 30-year fixed loan, from FRED's MORTGAGE30US series (6.71%, observed 2026-09-03). The same rate is used for every state, because a single national rate keeps the comparison focused on home prices and property tax, rather than mixing in regional rate differences this study isn't trying to measure.
Property tax uses each state's effective rate, meaning the tax people actually pay as a share of home value rather than the official millage rate. It comes from the Tax Foundation's 2026 report, based on 2024 American Community Survey data, and is applied to that state's own ZHVI home value.
- Not included: homeowners insurance, PMI (which applies below 20% down, a case this study doesn't model), HOA fees, and any state or local transfer taxes when you buy.
- Property tax rates vary by county and city within every state. The rate used here is a statewide figure, not the rate for any particular address.
- A different down payment, credit history or type of loan (FHA, VA, ARM) would change the P&I figure. This study holds those steady so that only location varies.
Frequently Asked Questions
Why is the property tax figure so different from what I pay?
⌄
This study uses each state's statewide effective rate, which is an average across all its counties. Real property tax varies by county and even by town within a state, often by a lot, so a particular address can be quite different from the statewide figure used here.
Does this include homeowners insurance or PMI?
⌄
No. Insurance costs vary too much by state, level of cover and personal circumstances to estimate reliably across a whole state, and PMI only applies below 20% down, which this study doesn't model. Both would add to every figure in the table.
Why use Zillow's Home Value Index instead of Census median home value?
⌄
ZHVI is a smoothed, seasonally adjusted measure of a typical home's value that Zillow publishes every month as a direct download, which keeps this study up to date and easy to reproduce. It measures much the same thing as the Census median, but the numbers aren't identical.
How often is this updated?
⌄
The table is rebuilt from a saved copy of the data whenever the sources are refreshed. The dates in the sources above show how current each figure is.
Sources
- Zillow Research — Home Value Index (ZHVI), by state — Typical home value by state, smoothed and seasonally adjusted, as of 2026-07-31. The basis for each state's home value in this study.
- FRED (Federal Reserve Bank of St. Louis) — 30-Year Fixed Rate Mortgage Average (MORTGAGE30US) — Weekly Freddie Mac PMMS 30-year fixed mortgage rate; this study uses the 2026-09-03 observation, 6.71%.
- Tax Foundation — Property Taxes by State and County — Effective property tax rate by state (2024 American Community Survey data, published in Tax Foundation's 2026 report). The basis for each state's property tax estimate.