BMI Calculator
Calculate BMI in metric or imperial units. Get your Body Mass Index, WHO category, the BMI chart and the normal-weight range for your height.
Written by Rahman · Last reviewed
Quick answer
BMI is your weight in kilograms divided by your height in metres squared, or, in imperial units, your weight in pounds times 703 divided by your height in inches squared. The World Health Organization classifies adult BMI below 18.5 as underweight, 18.5 to 24.9 as normal weight, 25 to 29.9 as overweight, and 30 or above as obese. BMI is a screening measure, not a diagnosis: it does not distinguish muscle from fat.
WHO adult cut-off points. BMI is a screening measure only — it does not separate muscle from fat, and it is interpreted differently for children, athletes, older adults and during pregnancy.
Embed this calculator on your site
A fixed-height frame — simplest option, works everywhere. Free to embed anywhere. The "Powered by A2Z Calc" link may not be removed.
Results are general screening estimates, not medical advice or a diagnosis. They can read inaccurately for athletes, older adults, children and during pregnancy. Speak to a doctor or registered dietitian before changing your diet, exercise or medication.
About the BMI Calculator
Body Mass Index (BMI) is a simple screening measure that relates weight to height. It is widely used to place adults into broad categories: underweight, normal weight, overweight or obese.
This calculator computes your BMI from height and weight in either metric or imperial units, shows the World Health Organization category it falls into, and gives the weight range that would place you in the normal-weight band at your height.
Metric: BMI = weight (kg) ÷ height (m)² Imperial: BMI = weight (lb) × 703 ÷ height (in)²
WHO categories: under 18.5 underweight, 18.5–24.9 normal, 25–29.9 overweight, 30 and above obese. The 703 factor converts pounds per square inch into kilograms per square metre, so both formulas give the same number.
An adult 170 cm tall weighing 68 kg has a BMI of 68 ÷ 1.70², which is 68 ÷ 2.89 = 23.5, inside the WHO normal-weight range. The same person in imperial units is 5 ft 7 in (67 inches) and 150 lb: 150 × 703 ÷ 67² = 105,450 ÷ 4,489 = 23.5. At 1.70 m, the normal-weight band of 18.5 to 24.9 corresponds to roughly 53.5 kg to 72 kg (118 lb to 159 lb).
What BMI does not tell you
BMI was devised in the 19th century as a population statistic, not an individual diagnostic. It uses height and weight and nothing else, so anything that changes body composition without changing either is invisible to it. That makes BMI a reasonable first filter and a poor final answer.
- Muscle mass: muscle is denser than fat, so lean, heavily trained people frequently read as overweight or obese while carrying very little fat.
- Fat distribution: BMI cannot separate abdominal fat from fat carried on the hips and thighs, and abdominal fat is the more metabolically risky of the two. A waist measurement supplies exactly what BMI misses.
- Age: adults tend to lose muscle and gain fat over time, so an unchanged BMI at 70 usually represents more body fat than the same number did at 30.
- Pregnancy: BMI is not valid during pregnancy. Care is guided by pre-pregnancy BMI and by recommended gestational weight-gain ranges instead.
- Height extremes: squaring height distorts the result at the tails, reading low for very short people and high for very tall people.
- Ethnicity: cardiometabolic risk begins to rise at lower BMI values in several populations, which is why some health bodies use additional lower thresholds.
None of this makes BMI useless. It tracks population-level risk well and costs nothing to measure. It simply cannot carry the weight of an individual diagnosis on its own.
BMI chart by height and weight
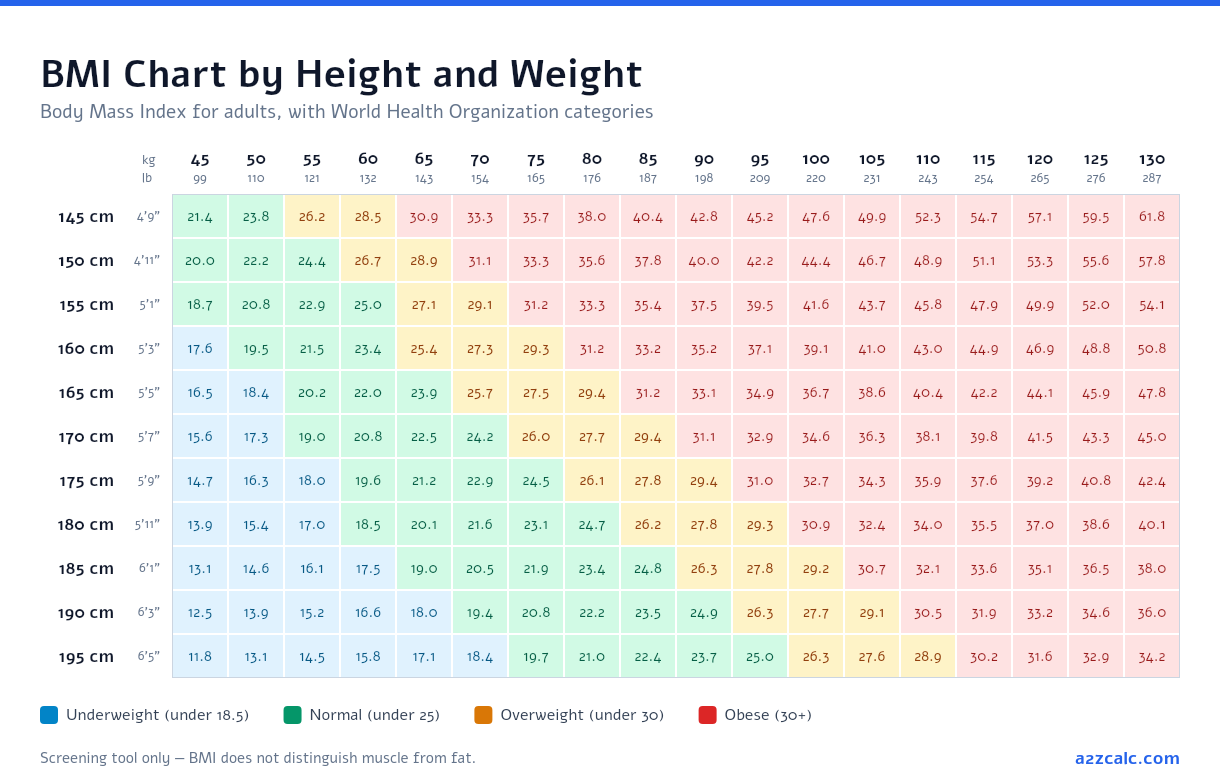
The chart below gives BMI for every combination of height from 145 cm to 195 cm and weight from 45 kg to 130 kg, with both imperial equivalents on the axes. Find your height down the left, your weight across the top, and read the value where they meet.
BMI Prime and the Ponderal Index
Two related figures appear alongside the main result. Both are attempts to make the same height-and-weight data easier to read.
- BMI Prime is simply your BMI divided by 25, the upper limit of the normal range. It turns the result into a ratio: exactly 1.00 sits on the boundary, 0.80 means you are 20% below it, and 1.20 means 20% above. The appeal is that it reads the same way regardless of which national threshold you use: a population using 23 as its cut-off can divide by 23 instead.
- The Ponderal Index divides weight by height cubed rather than squared. Because human mass scales closer to the cube of height than the square of it, this distorts less at the extremes, which is why it is preferred for very tall and very short people and used in neonatal assessment. The trade-off is that it has no widely agreed category thresholds, so the number is hard to interpret on its own.
Neither adds information that BMI does not already contain: they are the same two measurements rearranged. They are useful for comparison and for the height extremes where BMI is weakest, not as a second opinion.
BMI for children and teenagers
Adult categories do not apply to anyone under 20. A child's body composition changes continuously with growth, and it changes differently for boys and girls, so a fixed cut-off such as 25 carries no meaning at age nine.
A child's BMI is calculated with the same formula, then compared against reference data for children of the same age and sex. The resulting percentile (not the raw BMI) is what gets interpreted:
- Below the 5th percentile: underweight
- 5th to below the 85th percentile: healthy weight
- 85th to below the 95th percentile: overweight
- 95th percentile and above: obese
Percentile charts differ between countries because they are built from different reference populations, so the same child can land on slightly different numbers in the UK and the US. Growth is also uneven, which makes a single reading far less informative than the trend across several measurements. This calculator applies adult categories and is not suitable for under-20s.
Lower BMI thresholds for Asian populations
Type 2 diabetes and cardiovascular disease begin to appear at lower BMI values in people of South Asian, Chinese, Japanese, Korean and South-East Asian descent than in white European populations. At an identical BMI, these groups tend to carry more body fat, and more of it around the abdomen.
A WHO expert consultation examined this in 2004 and deliberately stopped short of issuing a replacement classification, concluding that the available data did not indicate a single clear cut-off point for all Asian populations. It recommended retaining the standard categories for international comparison, while identifying additional potential public health action points along the BMI continuum:
- 23.0: roughly where 25 sits on the standard scale
- 27.5: roughly where 30 sits on the standard scale
- 32.5 and 37.5: the two higher action points identified by the same consultation
In practice the first two are the ones that reached national guidance. In the UK, NICE recommends 23 to indicate increased risk and 27.5 to indicate high risk for people of South Asian, Chinese, other Asian, Middle Eastern, Black African and African-Caribbean family background.
This calculator reports the standard WHO categories. If you belong to one of these groups, read your result against the lower thresholds as well, and discuss it with a doctor rather than drawing your own conclusion from the number.
BMI chart: WHO categories for adults
| BMI | Category | What the classification means |
|---|---|---|
| Below 18.5 | Underweight | May reflect undernutrition or an underlying condition. Worth raising with a doctor. |
| 18.5 – 24.9 | Normal weight | The WHO reference range for most adults. |
| 25.0 – 29.9 | Overweight | Associated at population level with raised cardiovascular and metabolic risk. |
| 30.0 – 34.9 | Obesity class I | Higher associated risk. A waist measurement adds useful context. |
| 35.0 – 39.9 | Obesity class II | Higher associated risk again. |
| 40.0 and above | Obesity class III | The highest band in the WHO classification. |
Cut-off points apply to adults aged 20 and over. Children and teenagers are assessed against age- and sex-specific percentile charts instead. Several national health bodies apply lower cut-off points for people of South Asian, Chinese and other Asian descent.
Frequently Asked Questions
Is BMI an accurate measure of health?
⌄
BMI is a useful general screening tool but not a diagnosis. It does not distinguish muscle from fat, so very muscular people may read as overweight.
What is a healthy BMI range?
⌄
For most adults, the WHO considers 18.5 to 24.9 the normal range. Healthy ranges can differ for athletes, older adults and some ethnic groups.
Does BMI apply to children?
⌄
Not directly. Children and teenagers use age- and sex-specific BMI percentile charts instead of fixed adult categories.
Should I rely on BMI alone?
⌄
No. Combine it with other indicators such as waist measurement, body composition and advice from a healthcare professional.
Is BMI calculated differently for men and women?
⌄
No. The formula and the adult cut-off points are identical. Body composition does differ: women carry more essential body fat than men at the same BMI, which is one more reason the number is a weak guide to any individual’s health.
Can athletes have a high BMI?
⌄
Routinely. Muscle is denser than fat, so a lean, heavily trained athlete can read as overweight or even obese while carrying very little fat. Body-fat percentage is the more useful measure for this group.
What BMI is considered obese?
⌄
The WHO classifies 30 and above as obese, subdivided into class I (30 to 34.9), class II (35 to 39.9) and class III (40 and above).
How do I calculate BMI in feet, inches and pounds?
⌄
Convert your height to inches, then divide your weight in pounds by your height in inches squared and multiply by 703. For 5 ft 7 in (67 inches) and 150 lb: 150 × 703 ÷ 4,489 = 23.5. Switching this calculator to imperial units does it for you.
Do BMI thresholds differ by ethnicity?
⌄
In practice, yes. Risk rises at lower BMI values in South Asian, Chinese and several other populations, so a number of health bodies apply additional thresholds of 23 for increased risk and 27.5 for high risk. See the section on lower thresholds above.
Sources
- World Health Organization — Obesity and overweight — Defines adult overweight as BMI ≥ 25 and obesity as BMI ≥ 30.
- NHS — BMI calculator — UK guidance, with separate tools for adults and for children aged 2–17.
- NIH / NHLBI — Calculate your BMI — US National Institutes of Health adult BMI calculator.
- WHO Expert Consultation, Lancet 2004 — Appropriate body-mass index for Asian populations — Source of the 23.0, 27.5, 32.5 and 37.5 public health action points.